Building Roofprints 50cm/px
Included on a trial basis with ORCA™ HUNTR is a version of Building Roofprints 50cm/px.
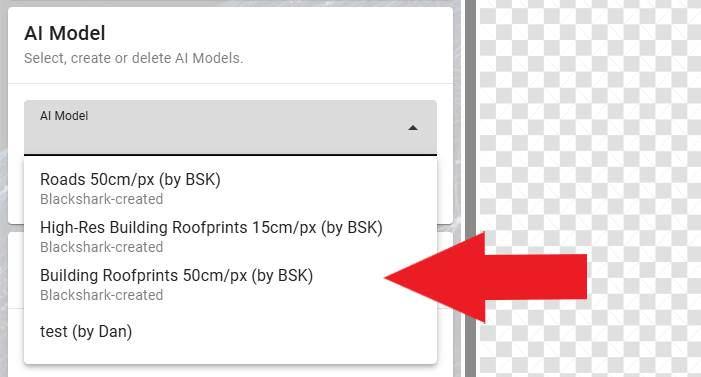
You can find the model already in the list of available trained models in the ORCA HUNTR - MAP view or in the list of available models when starting a run from the ORCA HUNTR - SCENES view.
The general input requirements for ORCA HUNTR must be met. Additionally, this model has the following input requirements:
- The image must be georeferenced
- The image must have at least 3 channels (RGB)
- The imagery should have a similar resolution to the training imagery (~50cm). This means detection quality will degrade significantly when out of the range between 30 and 70cm resolution.
The output is georeferenced. The vector output is available as polygons only.
Model Metrics
For this models and its metrics, a roofprint and its features, as presented in the satellite or aerial images, is defined as an intended target object meeting the following specifications: any permanent or semi-permanent man-made structure that has a footprint area equal to or greater than 6m2 and is covered by a roof.
Examples of intended roofprints include single-family homes, commercial buildings, industrial buildings, warehouses, stadiums, row houses, and public buildings.
Examples of intended excluded features include natural features, small sheds, water features (pools), roads, bridges, statues, and playing fields.
Product quality may vary for different parts of the globe as it can be affected by various factors like building shape, density distribution, image quality, and occlusions. Complex roof structures (e.g., gabled mixed with flat) when present in industrial zones may lead to lower quality detection.
To provide a comprehensive way to show the differing product quality, five different zones are used. The zoning types used are central business district (CBD), commercial, industrial, residential, and rural.
The following metrics are the observed metrics for the vectorized output of the Building Roofprints 50cm/px model as tested on the Maxar Vivid 50cm dataset.
| Accuracy of Roofprints per Region and Zone (Vectorized) | |||||
|---|---|---|---|---|---|
| REGION | CBD | Commercial | Industrial | Residential | Rural |
| Australia and New Zealand | 84 | 94 | 92 | 92 | 99 |
| Caribbean | 93 | 94 | 94 | 92 | 99 |
| Central America | 90 | 92 | 94 | 88 | 99 |
| Central Asia | 82 | 91 | 95 | 93 | 99 |
| Eastern Africa | 80 | 90 | 90 | 93 | 97 |
| Eastern Asia | 89 | 91 | 89 | 92 | 93 |
| Eastern Europe | 88 | 95 | 89 | 91 | 97 |
| Melanesia | 97 | 95 | 99 | 93 | 97 |
| Micronesia | 91 | 95 | - | 92 | 99 |
| Middle Africa | 87 | 93 | 95 | 90 | 97 |
| Northern Africa | 90 | 92 | 95 | 88 | 99 |
| Northern America | 90 | 93 | 94 | 91 | 99 |
| Northern Europe | 88 | 92 | 94 | 91 | 98 |
| Polynesia | - | 96 | 97 | 91 | 97 |
| South America | 87 | 94 | 95 | 85 | 98 |
| South-Eastern Asia | 86 | 94 | 94 | 92 | 99 |
| Southern Africa | 88 | 94 | 88 | 88 | 98 |
| Southern Asia | 85 | 90 | 90 | 93 | 96 |
| Southern Europe | 83 | 94 | 90 | 85 | 98 |
| Western Africa | 90 | 95 | 95 | 90 | 97 |
| Western Asia | 90 | 92 | 93 | 90 | 98 |
| Western Europe | 88 | 96 | 98 | 91 | 98 |
| F1 Score of Roofprints per Region and Zone (Vectorized) | |||||
|---|---|---|---|---|---|
| REGION | CBD | Commercial | Industrial | Residential | Rural |
| Australia and New Zealand | .67 | .89 | .75 | .83 | .85 |
| Caribbean | .88 | .93 | .79 | .81 | .78 |
| Central America | .85 | .88 | .80 | .83 | .74 |
| Central Asia | .72 | .78 | .87 | .84 | .73 |
| Eastern Africa | .75 | .88 | .84 | .76 | .51 |
| Eastern Asia | .79 | .87 | .89 | .86 | .71 |
| Eastern Europe | .81 | .91 | .83 | .81 | .79 |
| Melanesia | .82 | .88 | .80 | .76 | .59 |
| Micronesia | .85 | .89 | - | .85 | .84 |
| Middle Africa | .74 | .83 | .82 | .79 | .61 |
| Northern Africa | .82 | .90 | .84 | .82 | .77 |
| Northern America | .84 | .90 | .71 | .83 | .79 |
| Northern Europe | .74 | .89 | .83 | .85 | .86 |
| Polynesia | - | .89 | .93 | .81 | .82 |
| South America | .79 | .91 | .82 | .79 | .75 |
| South-Eastern Asia | .82 | .91 | .92 | .85 | .85 |
| Southern Africa | .84 | .89 | .82 | .78 | .43 |
| Southern Asia | .81 | .88 | .84 | .85 | .77 |
| Southern Europe | .75 | .89 | .72 | .77 | .79 |
| Western Africa | .80 | .89 | .82 | .81 | .62 |
| Western Asia | .68 | .77 | .78 | .81 | .71 |
| Western Europe | .75 | .92 | .95 | .81 | .81 |